


Table of Contents
- The Real Cost Drivers Behind a Data Center Cooling Upgrade
- Liquid Cooling vs Air Cooling Cost Comparison
- Data Center Cooling Energy Efficiency Standards and PUE Targets
- PUE Improvement Strategies That Cut Operational Costs
- Retrofitting vs Greenfield: Installation Costs and Downtime Risk
- Maintenance and Lifecycle Cost Projections for Cooling Systems
- Building Your Cooling Upgrade Cost Analysis: A Practical Framework
- Conclusion
- Frequently Asked Questions
Last Updated: September 18, 2026
The Real Cost Drivers Behind a Data Center Cooling Upgrade
A data center cooling upgrade cost analysis starts with one uncomfortable truth: the equipment quote is rarely the biggest number. The real spend sits in IT load, rack density, and heat dissipation.
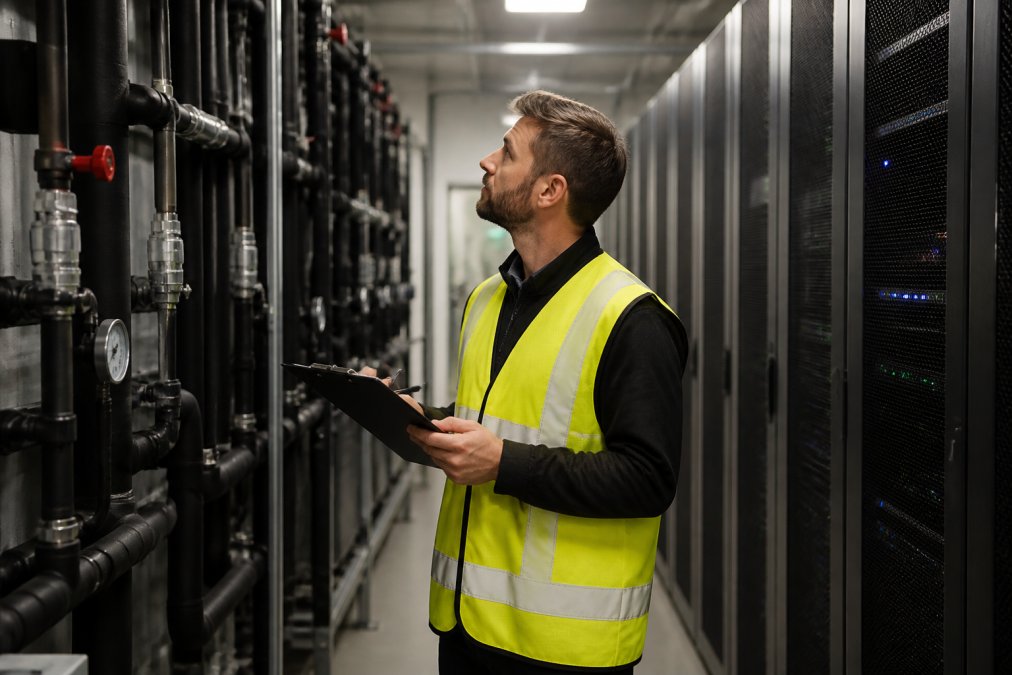
IT Load, Rack Density, and Heat Dissipation
Cooling capacity is dictated by IT load, not floor area. Two identical rooms can need different systems if one runs high-density GPU servers and the other legacy hardware.
Three variables drive the sizing decision:
- Total IT load in kilowatts across the room
- Peak rack density, measured per rack rather than averaged
- Heat dissipation requirements at the hottest point, not the coolest
CAPEX vs OPEX: Where the Money Actually Goes
CAPEX covers equipment, installation, and commissioning; OPEX covers power, maintenance, and lifecycle replacement. Most budget blowouts happen because teams plan the first and guess the second.
Liquid Cooling vs Air Cooling Cost Comparison
Liquid cooling costs more upfront than air cooling but usually wins on efficiency and density. The trade-off depends on your IT load and room to grow.
| Factor | Air Cooling | Liquid Cooling |
|---|---|---|
| Upfront CAPEX | Lower | Higher |
| Cooling efficiency | Moderate | High |
| Rack density support | Limited | Very high |
| Retrofit complexity | Lower | Higher |
| Best for | Low-medium density | High-density, GPU servers |
Direct-to-Chip and Immersion Cooling: Real Costs
Direct-to-chip cooling runs coolant through cold plates mounted on processors, targeting heat at the source.
Data Center Cooling Energy Efficiency Standards and PUE Targets
Power Usage Effectiveness (PUE) is the ratio of total facility energy to energy delivered to IT equipment. A PUE of 1.0 is theoretically perfect; anything above is overhead.
PUE Improvement Strategies That Cut Operational Costs
PUE improvement strategies cut operational expenditure without replacing every cooling unit. The cheapest wins come from airflow and control changes first.
- Containment of hot and cold aisles
- Raised supply air setpoints within equipment tolerances
- Variable-speed fans and intelligent controls
- Free cooling where climate and design allow
- Regular filter and coil maintenance to protect the energy efficiency ratio
Retrofitting vs Greenfield: Installation Costs and Downtime Risk
Retrofitting costs less in capital but more in planning and risk. Greenfield builds offer clean design and lower disruption but demand land, time, and a much larger upfront commitment. The gap most cost analyses miss: retrofit economics are dominated by labour and sequencing, not equipment, and that's where budgets quietly blow out.
Where Retrofit Costs Actually Land
A retrofit reuses the shell, electrical backbone, and often the existing chiller plant, saving capital on paper but shifting spend into four categories greenfield builds avoid:
- Out-of-hours labour. Live IT load means mechanical and electrical work happens in maintenance windows, typically at night or on weekends. Award rates and penalty loadings under the relevant industrial instrument can push labour cost well above standard day rates, and the premium applies to every trade on site.
- Temporary cooling. Bridging the transition usually means hiring portable chillers, fan walls, or spot coolers. Hire is charged weekly, and a staged rollout across multiple halls can run for months.
- Staging and make-safe works. Isolating circuits, erecting containment around live racks, and protecting existing infrastructure add scope that never appears on a greenfield bill of materials.
- Re-commissioning and integrated systems testing. Existing building management systems rarely accept new plant without rework, and integrated testing across old and new controls is a specialist cost.
Costing Downtime Risk During Cooling Upgrades
A structured assessment should cover four things:
- Which circuits and units can be isolated without affecting live IT load
- Whether temporary cooling can bridge the transition period, and at what hire cost
- The sequencing of electrical and mechanical work to avoid single points of failure
- Rollback procedures if commissioning reveals a fault
At Treske Pty Limited, we plan upgrades around the customer's uptime requirements first, then design the installation sequence to match. That approach is why healthcare and managed service clients trust us with zero-disruption work.
Stulz Minispace Data Center Cooling 6kw →
Maintenance and Lifecycle Cost Projections for Cooling Systems
Lifecycle cost is where cheap equipment becomes expensive. A cooling system's true cost includes maintenance, energy, and replacement over its full service life, not just year one. Most cost analyses stop at the equipment quote; maintenance and lifecycle replacement can rival the original CAPEX over ten years.
The Maintenance Cost Drivers That Scale With Technology
Maintenance cost is not a flat annual figure. It scales with the cooling technology, load density, and how accessible the plant is for servicing.
A Phase-by-Phase Lifecycle Cost Framework
Budget for three lifecycle phases, populated with real line items rather than percentages:
- Years one to three, warranty and baseline. Manufacturer warranty covers major components. Costs are routine servicing, filter and consumable replacement, and control checks. Energy consumption dominates this phase, so efficiency gains here compound.
- Years four to seven, component replacement and fluid management. Pumps, fans, valves, and sensors reach end of life and are replaced. Coolant or refrigerant is tested, topped up, or replaced. Control systems may need firmware or hardware upgrades to stay supported. This is where the maintenance cost difference between air and liquid cooling becomes visible.
- Years eight plus, overhaul or replacement planning. Major components such as compressors, chillers, and coolant distribution units approach end of life. The decision is overhaul versus replace, modelled against the cost of a full upgrade so the business case for early replacement is visible.
Why This Matters for the Upgrade Decision
The lifecycle model turns a cooling upgrade cost analysis from a procurement exercise into an investment case. A higher-efficiency option with higher maintenance complexity may still win on total cost of ownership, but only if fluid, labour, and spares costs are modelled rather than assumed. Conversely, a cheaper air-cooled retrofit may be correct for a low-density facility where liquid cooling's maintenance overhead never pays back.
Building Your Cooling Upgrade Cost Analysis: A Practical Framework
A defensible cooling upgrade cost analysis follows a repeatable sequence. Skip a step and you'll under-budget somewhere that matters.
- Establish your baseline. Measure current IT load, rack density, and PUE over at least one month.
- Define the growth target. Decide the density and capacity you need to support in three to five years.
- Model CAPEX. Price equipment, installation, electrical works, and commissioning for each option.
- Model OPEX. Estimate energy consumption, maintenance, and lifecycle replacement over ten years.
- Assess downtime risk. Map the installation sequence against your uptime requirements.
- Compare total cost of ownership. Weigh retrofit against greenfield on the same basis.
- Validate with a specialist. Have an agnostic provider review the design before you commit.
| Upgrade Option | Upfront CAPEX | Ongoing OPEX | Downtime Risk |
|---|---|---|---|
| Air cooling retrofit | Low | Moderate | Low |
| Liquid cooling retrofit | High | Low | Moderate-high |
| Greenfield build | Very high | Low | Low |
Conclusion
Balancing capital, operational, and lifecycle costs against uptime requirements is the hardest part of any cooling upgrade. Get it right and the facility runs cooler, leaner, and more resilient for a decade.
Last updated: September 18, 2026
Frequently Asked Questions
What are the primary cost drivers in a data center cooling upgrade?
The main cost drivers are IT load and rack density, which determine how much heat dissipation capacity you need. CAPEX covers equipment, coolant distribution units, chiller plant modifications, and installation labour. OPEX includes energy consumption, maintenance, and coolant replacement. Retrofitting into an existing facility often adds cost because you need to work around live infrastructure, manage downtime risk, and potentially upgrade power distribution alongside cooling. A thorough cooling upgrade cost analysis should map both CAPEX and OPEX across a 10-year lifecycle.
Is liquid cooling more cost-effective than air cooling for existing facilities?
It depends on your rack density and IT load. For densities under 15 kW per rack, air-cooled systems like the Stulz MiniSpace (6 kW to 32 kW) remain the most cost-effective option for most existing facilities. Above 30 kW per rack, direct-to-chip or immersion liquid cooling becomes necessary, and while the upfront CAPEX is higher, the cooling efficiency gains can reduce energy consumption significantly. Retrofitting liquid cooling into a legacy facility often requires additional plumbing, coolant distribution units, and floor reinforcement, which adds to the total cost of ownership.
How do you calculate the ROI of a data center cooling system upgrade?
Start by benchmarking your current PUE and annual energy consumption. Then model the expected PUE improvement from the upgrade and calculate the energy savings against your current electricity tariff. Subtract the total project cost (equipment, installation, commissioning, and any downtime-related costs) from the cumulative savings over 5 to 10 years. Include maintenance savings from newer, more reliable equipment. A well-designed cooling upgrade typically targets a PUE reduction of 0.2 to 0.4, though actual results depend on climate, IT load profile, and facility design.
What long-term operational savings can a high-efficiency cooling upgrade deliver?
High-efficiency cooling systems reduce energy consumption through variable-speed fans, improved heat transfer, and tighter temperature control. For a facility running 500 kW of IT load, improving PUE from 1.8 to 1.4 can cut annual cooling energy costs by 20 to 30 percent, depending on local energy tariffs. Maintenance costs also drop when you move from older fixed-speed units to modern EC fan systems with filter control managers. Lifecycle analysis should factor in a 10 to 15 year equipment lifespan and account for coolant distribution unit servicing and chiller plant efficiency degradation over time.