

Table of Contents
- What Data Centre Energy Efficiency Actually Means in Practice
- Data Centre Power Usage Effectiveness (PUE): Your Baseline Metric
- Data Centre Cooling Best Practices That Deliver Measurable Results
- NABERS for Data Centres: Ratings, Reporting, and Compliance
- Electrical Infrastructure: UPS, PDUs, and Power Distribution Optimisation
- DCIM and AI-Driven Monitoring to Improve Energy Efficiency in Data Centers
- Server Virtualisation, IT Load Management, and Hardware Refresh
- Frequently Asked Questions
Last Updated: August 31, 2026
What Data Centre Energy Efficiency Actually Means in Practice
Improving energy efficiency in data centres has become a board-level priority driven by rising energy costs, sustainability obligations, and escalating power demands from AI workloads. At Treske Pty Limited, we work with data centre managers across Australia and New Zealand tackling this challenge: how to reduce energy consumption without compromising high availability.
Data centre energy efficiency is the discipline of delivering the same or greater IT compute output while consuming less electrical power across cooling, power distribution, and IT load systems. It spans physical infrastructure decisions, software-driven monitoring, and operational discipline.
Below, we cover the metrics that establish your baseline, the cooling and electrical strategies delivering the biggest returns, the compliance framework you need, and the monitoring tools that make it measurable. We address AI-driven predictive maintenance and liquid cooling implementation where most guides stop short.
Data Centre Power Usage Effectiveness (PUE): Your Baseline Metric
Power Usage Effectiveness (PUE) is the ratio of total facility energy consumed to the energy delivered to IT equipment. A PUE of 1.0 is theoretical perfection; a PUE of 2.0 means that for every watt powering your servers, another watt is lost to cooling, lighting, and power conversion overhead.
PUE is the starting point for any serious efficiency programme. Without it, you're optimising blind.
How to Calculate and Interpret Your PUE Score
The formula is straightforward:
PUE = Total Facility Power (kW) ÷ IT Equipment Power (kW)
Total facility power comes from your utility meter or main distribution board. IT equipment power is measured at the power distribution units (PDUs) feeding your server racks. Many operators estimate IT load from nameplate ratings rather than measuring actual draw, which inflates apparent PUE and masks genuine inefficiency.
Measure over a rolling 30-day period to account for load variation. A single-point snapshot will give you a misleading picture.
| PUE Score | Efficiency Level | Typical Facility Type |
|---|---|---|
| 1.0 - 1.2 | Excellent | Hyperscale, purpose-built modern |
| 1.2 - 1.5 | Good | Well-optimised enterprise |
| 1.5 - 2.0 | Average | Typical enterprise or legacy |
| 2.0+ | Poor | Older, unoptimised facilities |
Setting Realistic PUE Improvement Targets
Most enterprise data centres operating legacy infrastructure sit between 1.6 and 2.2. Set targets in stages rather than chasing sub-1.3 PUE without significant capital investment.
According to the Green Grid's PUE guidelines and metrics, PUE should be measured at the IT equipment level rather than the rack level for consistency across facilities.
Data Centre Cooling Best Practices That Deliver Measurable Results
Cooling accounts for 30-40% of total facility power in most data centres (the CDC). Getting cooling right is the single highest-impact lever available to most operators, and many effective interventions cost relatively little to implement.

Hot and Cold Aisle Containment
Hot and cold aisle containment prevents hot exhaust air from server rear panels from mixing with cold supply air before it reaches server intakes. Without containment, cooling units work harder to compensate for recirculation. With containment, you can raise cooling setpoints, reduce fan speeds, and maintain safe inlet temperatures at every rack.
Cold aisle containment encloses the cold aisle with overhead panels and end doors, creating a pressurised cold air plenum. Hot aisle containment captures exhaust air directly and routes it back to cooling units. The right choice depends on your existing infrastructure layout and rack density.
The APC by Schneider Electric NetShelter Aisle Containment system, available through Treske, is a well-proven solution for retrofit deployments compatible with standard 600mm and 750mm aisle widths.

Liquid Cooling and Free Cooling Options
Liquid cooling has moved from niche to mainstream, driven by the thermal density demands of GPU clusters and AI inference hardware. Air cooling becomes impractical above roughly 15-20 kW per rack; liquid cooling handles densities well above 100 kW per rack.
Main implementation options include rear-door heat exchangers (attach to existing racks, require chilled water supply), direct liquid cooling (cold plates attached directly to CPUs and GPUs, highest efficiency), and immersion cooling (IT equipment submerged in dielectric fluid, maximum thermal performance, highest upfront cost).
Rear-door heat exchangers are the lowest-barrier entry point for facilities already running chilled water infrastructure. Free cooling uses ambient outdoor air or water-side economisers to reject heat without mechanical refrigeration during cooler periods. For most of Australia's climate zones, free cooling hours are limited but still meaningful, particularly overnight and during winter.
HVAC Efficiency and Economiser Integration
CRAC and CRAH unit efficiency degrades significantly when units operate at partial load or with poor airflow management. Common issues include oversized units running at low utilisation, multiple units with conflicting setpoints, dirty coils reducing heat transfer, and economiser dampers stuck closed.
A coordinated HVAC efficiency audit typically identifies setpoint conflicts and dead-banding issues correctable without capital expenditure. Economiser integration should be automated rather than manually managed.
NABERS for Data Centres: Ratings, Reporting, and Compliance
NABERS (National Australian Built Environment Rating System) is the national framework for measuring and comparing data centre energy performance. Administered by the NSW Department of Planning, Housing and Infrastructure, NABERS for Data Centres provides a standardised, independently verified rating from 1 to 6 stars, covering IT energy efficiency, cooling efficiency, and power distribution losses.
A 6-star NABERS rating represents market-leading performance; a 3-star rating reflects average market practice. NABERS ratings are increasingly relevant for compliance, procurement, and sustainability reporting. Government agencies and large enterprises are progressively requiring NABERS ratings as part of procurement criteria.
For organisations subject to the Safeguard Mechanism under the Climate Change Act 2022 (Cth), accurate energy reporting is mandatory. Data centres above the facility emissions threshold must report to the Clean Energy Regulator and may face obligations to reduce emissions intensity. NABERS provides the verified data trail supporting this reporting.
Electrical Infrastructure: UPS, PDUs, and Power Distribution Optimisation
Significant energy losses accumulate silently in the electrical powertrain between utility supply and server NIC. Modern double-conversion UPS systems typically operate at 92-96% efficiency under full load, but most enterprise UPS systems run at 40-60% of rated capacity, where efficiency curves drop sharply. Operating two smaller UPS units in parallel at higher utilisation each often outperforms a single oversized unit.
Intelligent PDUs with per-outlet power metering provide granular visibility into IT load at the rack level. Without this data, you cannot accurately calculate PUE, identify underutilised hardware, or detect anomalous power draw.
Key electrical infrastructure optimisation steps:
- Audit UPS operating load percentages and identify candidates for right-sizing or consolidation
- Replace older transformer-based UPS with modern double-conversion or eco-mode capable units
- Deploy intelligent PDUs with per-outlet metering in all production racks
- Review cable routing and distribution panel configurations for unnecessary conversion stages
- Validate automatic transfer switch (ATS) testing schedules do not create unnecessary switching events
According to the Australian Energy Regulator's guidance on commercial energy efficiency, systematic electrical infrastructure audits routinely identify 10-20% energy savings in commercial and industrial facilities, with data centres among the highest-opportunity categories.
DCIM and AI-Driven Monitoring to Improve Energy Efficiency in Data Centers
Improving energy efficiency at scale requires continuous, automated visibility across thermal conditions, power consumption, and IT load, with intelligence to predict problems before they cause failures or force inefficient cooling responses.
Data Centre Infrastructure Management (DCIM) software integrates sensor data, power metering, and IT asset inventories into a unified management environment.
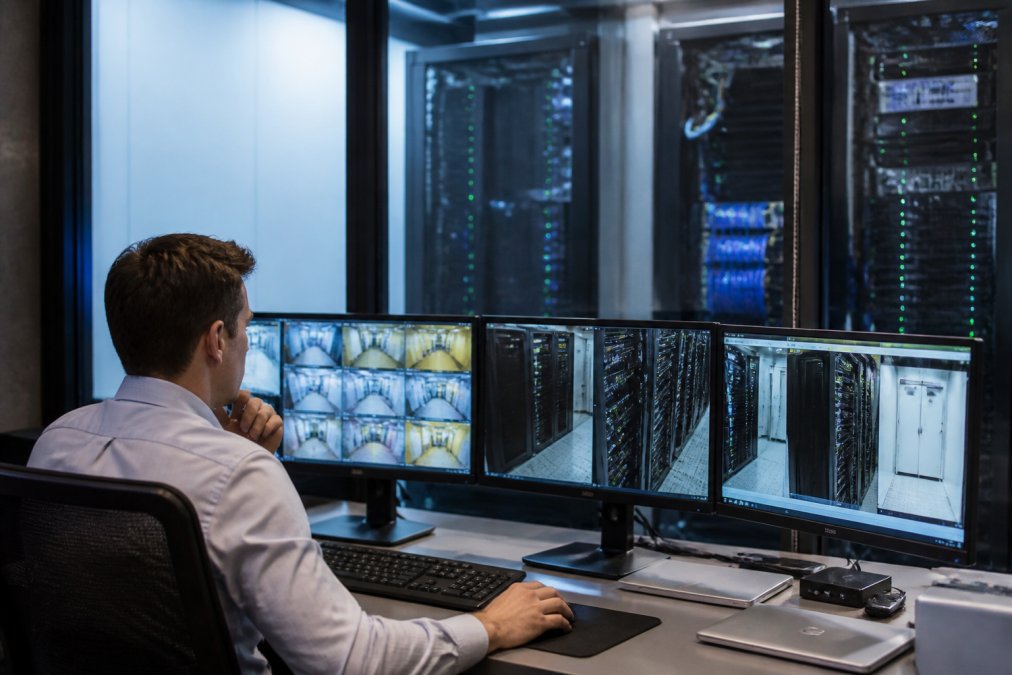
EkkoSoft Critical: 3D Thermal Monitoring and Predictive Maintenance
EkkoSoft Critical, available through Treske via the Ekkosense Datacenter Optimization platform, maps real-time temperature and humidity data across your data centre's physical layout, identifying hot spots, cold spots, and airflow anomalies that traditional monitoring misses.
The predictive maintenance capability flags developing issues before they reach critical levels, shifting maintenance from reactive to predictive and reducing both energy waste from overcooling and unplanned downtime risk. For capacity planning, the platform models the thermal impact of proposed hardware additions before installation.
The Ekkosense Datacenter Optimization platform supports ESG reporting requirements by providing auditable energy consumption and thermal performance data.
EcoStruxure IT: Remote Visibility Across Multiple Sites
For organisations managing infrastructure across multiple facilities, APC by Schneider Electric's EcoStruxure IT provides consolidated remote visibility into power, cooling, and environmental conditions from a single dashboard.
EcoStruxure IT collects real-time data from UPS systems, PDUs, CRAC/CRAH units, and environmental sensors, presenting configurable dashboards surfacing metrics relevant to each role. Operations teams see real-time alerts; management sees trend data and efficiency KPIs. Remote access is particularly valuable for edge data centres where on-site staffing is limited.

EcoStruxure IT is available through Treske and integrates directly with APC hardware.
Server Virtualisation, IT Load Management, and Hardware Refresh
The most energy-efficient server is one that isn't running. Many enterprise data centres carry significant volumes of underutilised physical hardware consuming power around the clock while delivering minimal compute value.
Server virtualisation consolidates multiple workloads onto fewer physical hosts, improving IT load per server and reducing active machines. A structured IT load management review should identify servers running below 20% average CPU utilisation, virtual machines with no active users, test environments that can be powered down outside business hours, and hardware older than five to seven years where performance-per-watt has fallen significantly behind current generation.
Hardware refresh decisions should be evaluated on a performance-per-watt basis. Current-generation processors deliver substantially more compute per watt than hardware from five or more years ago. The energy cost difference over three years frequently justifies accelerated refresh cycles.
Edge computing faces the same efficiency challenges at smaller scale. Improving energy efficiency at the edge requires the same disciplines: containment, right-sized UPS, intelligent PDUs, and DCIM visibility. Per-rack energy cost at the edge is often higher than at centralised facilities, making efficiency gains proportionally more valuable.
A practical hardware refresh and virtualisation checklist:
- Run a server utilisation audit covering 90 days of CPU, memory, and storage data
- Identify physical servers with average utilisation below 20%
- Catalogue all servers older than five years and assess performance-per-watt against current equivalents
- Map virtualisation candidates among legacy application workloads
- Schedule decommissioning of confirmed zombie servers with change management approval
- Evaluate edge node configurations for containment and UPS right-sizing opportunities
Energy costs, sustainability obligations, and growing AI workload density are making data centre efficiency a non-negotiable operational priority. Treske Pty Limited provides end-to-end critical infrastructure solutions, from aisle containment and intelligent PDU deployment to DCIM software and UPS optimisation, across facilities throughout Australia and New Zealand. Our technology-agnostic approach means we specify what works for your environment. Visit us today to discuss how we can help you improve energy efficiency in data centres and build a measurable, auditable case for your next infrastructure investment.

===
Frequently Asked Questions
How can Australian data centres improve their Power Usage Effectiveness (PUE)?
Start by measuring your current PUE accurately using sub-metering across IT load, cooling, and power distribution. The most impactful improvements typically come from hot and cold aisle containment, raising server inlet temperatures to ASHRAE recommended ranges, deploying economisers where the local climate allows, and replacing ageing UPS units with high-efficiency models. DCIM software such as EkkoSoft Critical can identify thermal hotspots and cooling waste that manual audits miss, accelerating PUE gains.
What role does NABERS play in data centre energy efficiency?
NABERS for data centres provides a nationally recognised rating scale from 0 to 6 stars that benchmarks a facility's energy performance against comparable operations. A higher NABERS rating signals lower carbon footprint and operational cost, and is increasingly required for government procurement and ESG reporting. The rating covers both IT load and facility overhead, so improvements to cooling infrastructure, power distribution, and server virtualisation all contribute directly to a better score.
What are the primary drivers of energy consumption in modern data centres?
Cooling infrastructure typically accounts for the largest share of non-IT energy use, often 30 to 40 percent of total facility consumption. Power distribution losses through UPS systems and PDUs add further overhead. On the IT side, underutilised physical servers running at low average loads consume disproportionate power relative to the work they perform. Addressing all three areas together, through cooling redesign, electrical powertrain optimisation, and server virtualisation, produces the most significant efficiency gains.
How does rack enclosure optimisation reduce energy waste?
Poorly sealed racks allow hot exhaust air to recirculate back to server inlets, forcing cooling systems to work harder to maintain safe temperatures. Blanking panels, brush strips, and structured cabling management eliminate these bypass airflow paths. Pairing sealed enclosures with a formal hot and cold aisle containment strategy, such as the APC by Schneider Electric NetShelter Aisle Containment system, prevents hot and cold air mixing at the row level, directly reducing the cooling IT load and improving overall PUE.
This article was written using GrandRanker